Inside China's bond market: size, structure, and the yield curve
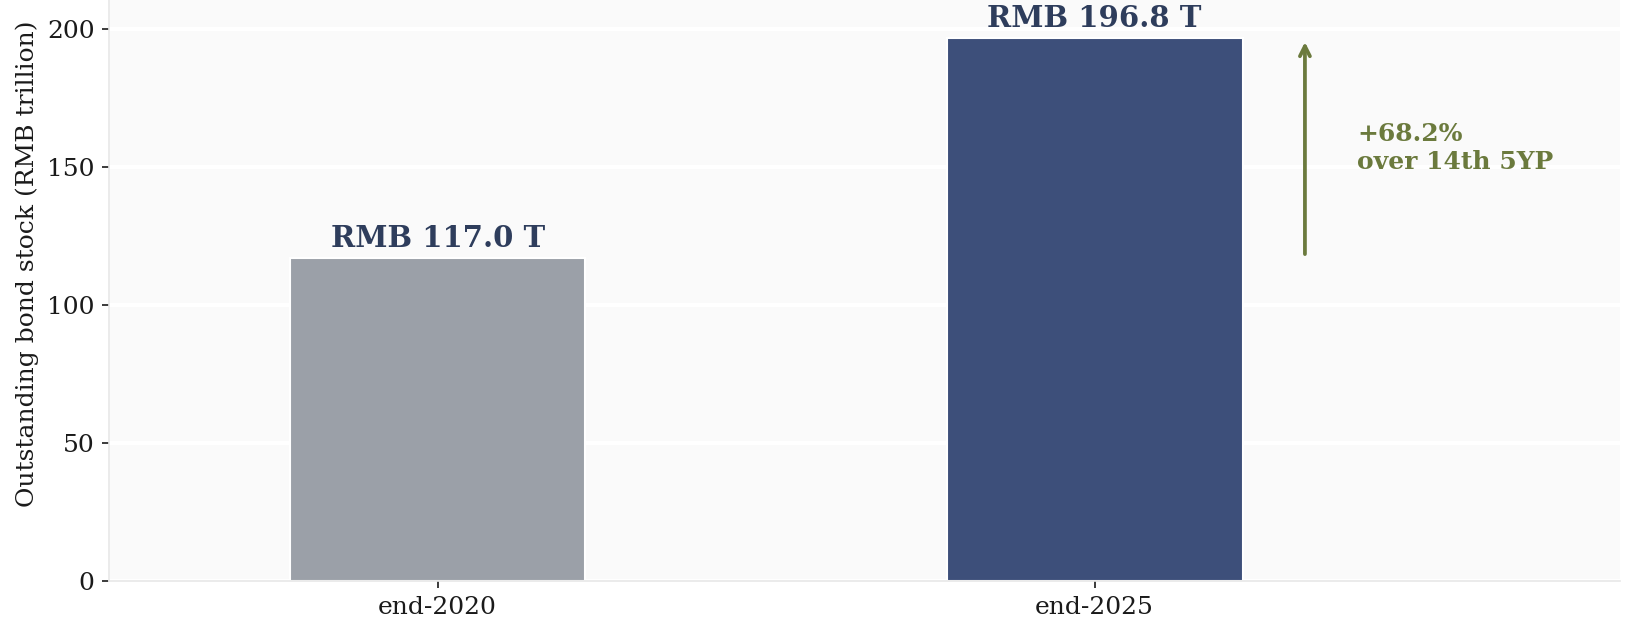
China runs one of the larger bond markets in the world by outstanding stock, built mainly on government, policy-bank, and credit issuance. The shape of that market, and the yield curve it produces, is the reference point for pricing nearly every other RMB-denominated asset.
How the market is built
Outstanding bonds split broadly into sovereign and quasi-sovereign issuance, government bonds and policy-bank bonds, alongside financial institution bonds and corporate credit. Government and policy-bank paper carries the bulk of the stock and anchors the risk-free end of the curve, while corporate and financial credit trades at a spread above it. New issuance each year tracks fiscal needs on the government side and funding plans on the corporate side, and the composition of that issuance shifts with the broader credit cycle: heavier government issuance in years when fiscal support is doing more of the macro work, heavier corporate issuance when credit demand from the private sector is stronger.
The yield curve as a pricing anchor
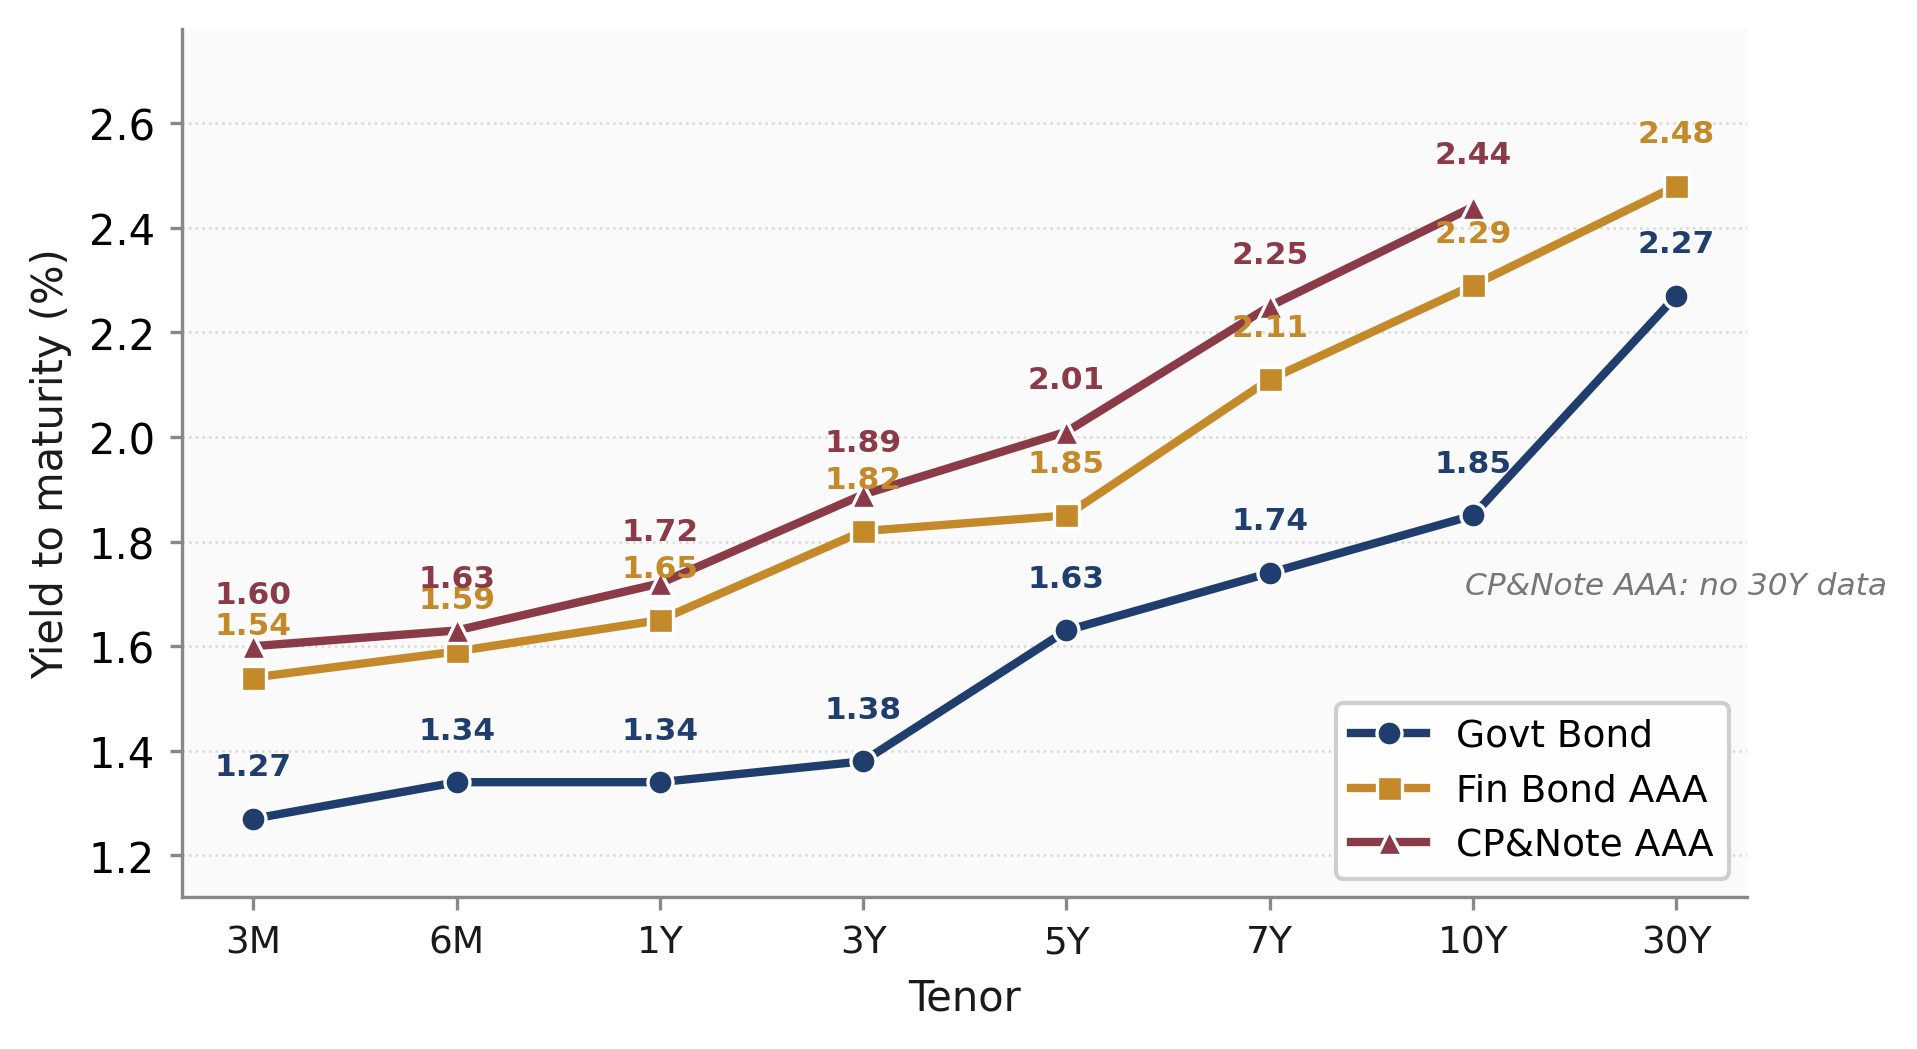
The government bond yield curve, published and maintained by ChinaBond, sets the benchmark across maturities from short bills to long-dated bonds. Financial and corporate curves price as a spread over this government curve, and the shape of the curve itself, how steep or flat it runs between short and long maturities, is read as a signal of growth and policy expectations in much the same way the US Treasury curve is read in dollar markets. A flattening curve typically points to expectations of slower growth or further easing ahead; a steepening curve points the other way.
How foreign capital gets in
Offshore investors hold Chinese government bonds mainly through two routes: direct access to the China Interbank Bond Market, and Bond Connect, the mutual-market link with Hong Kong that settles through international custodians without requiring a separate onshore account. Both channels sit inside a broader framework of managed capital-account opening that has widened steadily over the past decade. The foreign holdings composition, which channel investors use and which maturities they concentrate in, is itself a signal of how comfortable global capital is with onshore RMB rate risk at a given point in time.
Reading stock, issuance, and the curve together
The two charts below show the outstanding stock and 2025 issuance mix first, then the yield curve and foreign holdings composition at end-2025. Read together, they answer two different questions. The stock and issuance chart shows where the market's weight sits and which part of the system is doing the borrowing this year. The yield curve and holdings chart shows how that borrowing is being priced and who outside China is willing to hold it. A market with deep government issuance but a flat curve and thin foreign participation tells a different story than one with the same issuance volume but a steeper curve and rising offshore holdings.