Inside Japan's JGB market: how the yield curve is built and where the BOJ steps in
Through much of the past decade, the yield that anchored Japan's bond market traded where the Bank of Japan chose to hold it. In 2024 that policy was dismantled, and the Japanese Government Bond curve began moving back toward market pricing. Reading it now means understanding how the curve is built, from the Ministry of Finance that decides what to issue to the central bank that decides how heavily to lean on the result.
Who issues the bonds, and who sets the calendar
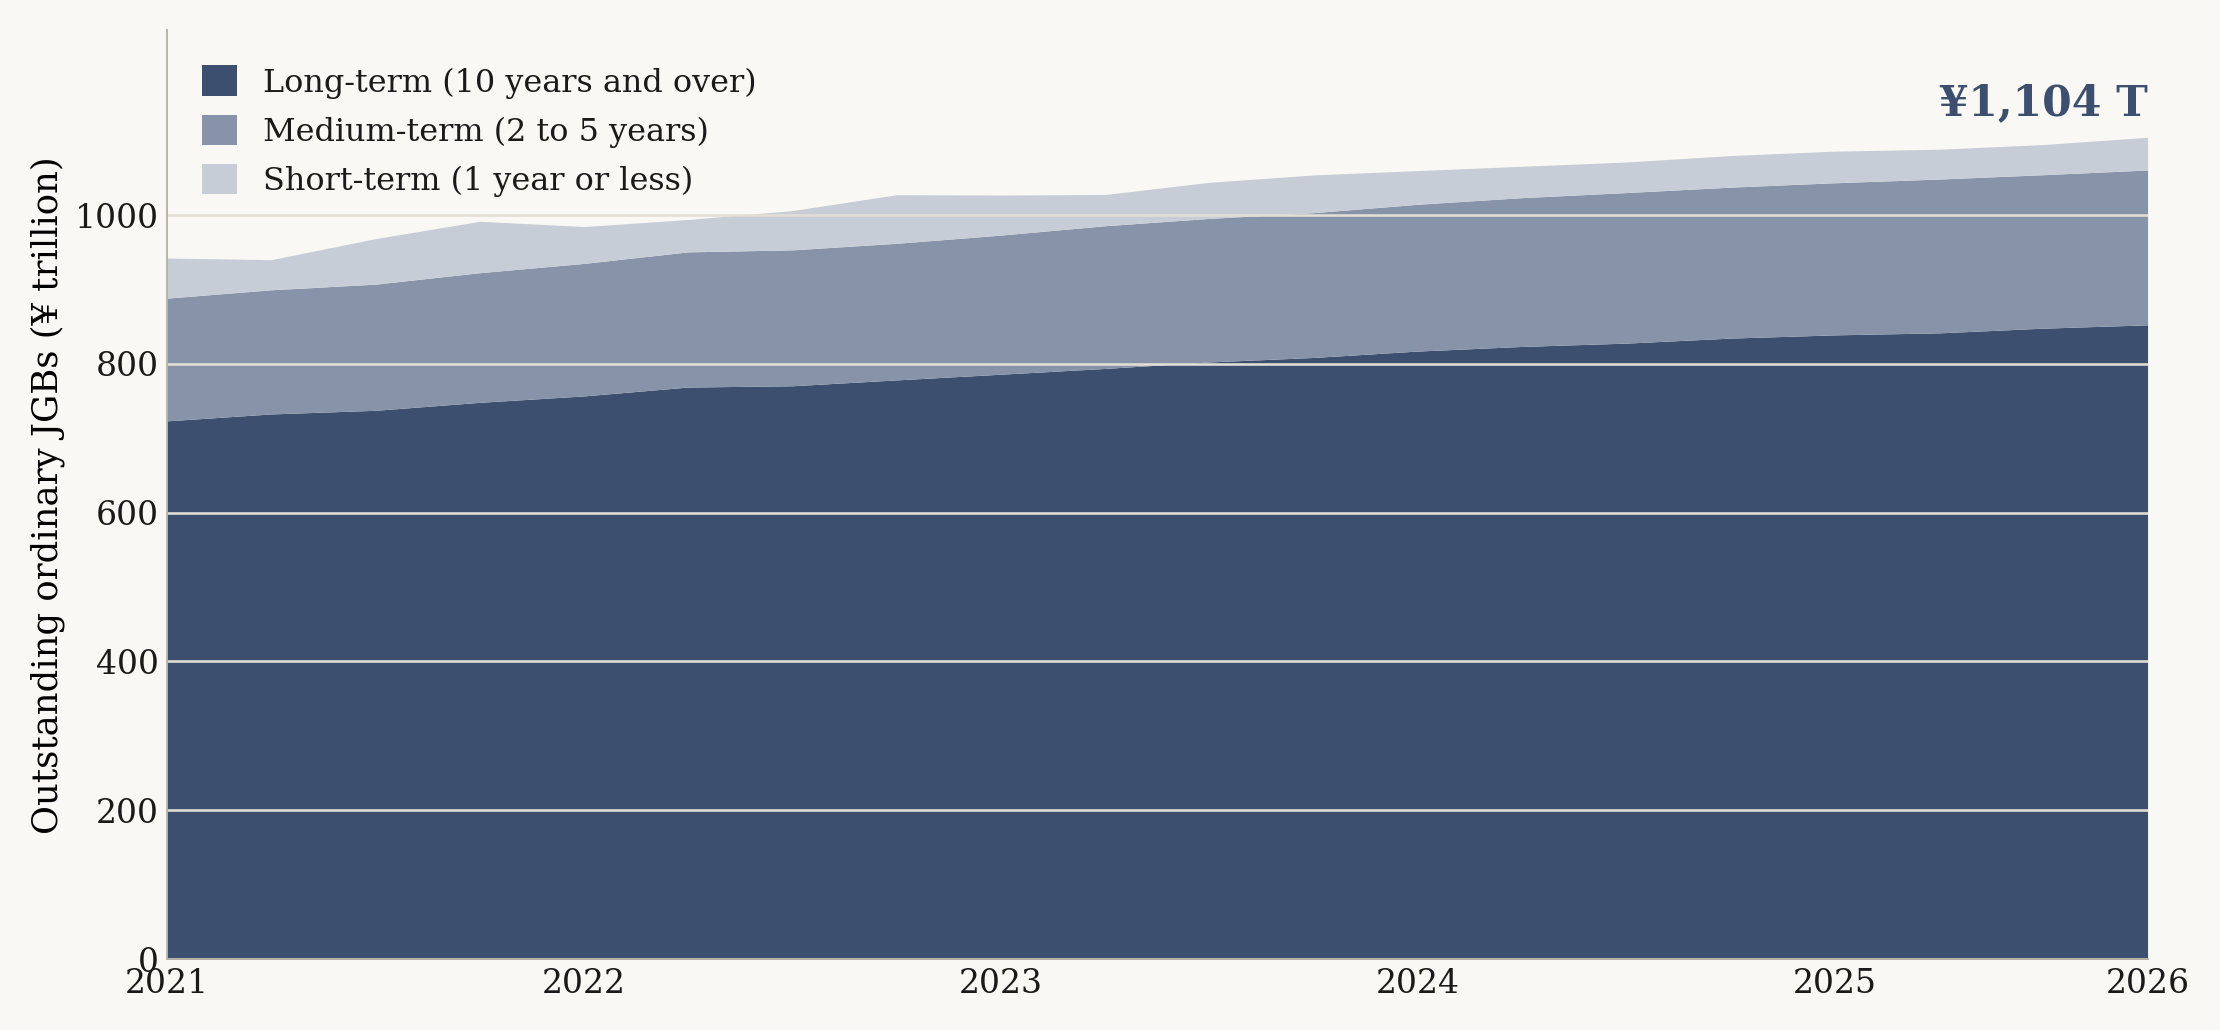
Japanese Government Bonds, JGBs, are issued by the Ministry of Finance on a regular auction calendar that runs across the maturity spectrum, from short treasury discount bills through 2, 5, 10, 20, 30 and 40 year tenors, alongside inflation-linked lines. The auctions clear through a primary-dealer system: a designated group of dealers bids at each sale and distributes the bonds onward to banks, insurers, pension funds and other investors.
The 10-year is the maturity the market treats as the benchmark, the reference point that other tenors are quoted around. Domestic institutions have traditionally held the bulk of the outstanding stock, with foreign participation concentrated in shorter maturities and in the futures and repo markets where positioning is easier to put on and take off. The supply side matters because the volume of issuance and its maturity mix set the raw material the curve is priced from.
How the Bank of Japan became the dominant force in the curve
From 2013, under the policy then labelled quantitative and qualitative easing, the Bank of Japan bought JGBs at scale and accumulated a holding large enough to shape the secondary market. In 2016 it added two tools that changed how the curve was set. It applied a negative rate to a tier of bank reserves, which pulled the front end below zero, and it introduced yield curve control, an explicit target for the 10-year yield held around zero within a tolerance band.
The mechanism of yield curve control is worth stating plainly. The central bank stood ready to conduct fixed-rate purchase operations of effectively unlimited size to defend the cap, so the 10-year traded where policy placed it rather than where supply and demand alone would have cleared. With the benchmark pinned, the rest of the curve was anchored off that point. For several years the result was a curve whose middle was administered, whose front was held down by the rate floor, and whose long end carried what remained of market-driven term premium.
The normalization turn
In 2024 the Bank of Japan ended the negative rate and ended yield curve control, removing the explicit 10-year target. It began lifting its short-term policy rate from the floor and slowing the pace of its JGB purchases, a shift toward letting the balance sheet run down over time.
The change in mechanism is the part that matters for reading the curve. With the peg gone, the 10-year yield is set again by the balance of supply, demand and expectations, and less by a defended line in the sand. The central bank's existing holdings still weigh on the market, because the speed at which it allows those holdings to mature governs how much free float returns to other investors. The curve is moving from an administered regime toward one where the market does more of the pricing, while the central bank's balance sheet remains a heavy presence in the background.
What the curve encodes now
Each segment of the curve answers a different question. The front end tracks the policy rate and the market's expectation of where it goes next. The belly reflects the balance between fresh issuance and the central bank's runoff, together with inflation expectations over the medium term. The long end, the 20, 30 and 40 year sectors, carries term premium and responds to the demand of life insurers and pension funds matching long-dated liabilities, set against the fiscal supply the Ministry of Finance brings to those maturities.
An analyst reads the steepness of the curve and the spreads between maturities as a gauge of how the market is pricing the normalization path against the issuance load. A curve that steepens at the long end while the front stays anchored tells a different story from one that flattens as policy expectations rise.
Why the JGB curve reaches beyond Japan
For years, low and pinned JGB yields anchored one side of global carry positioning. Investors could borrow cheaply in yen and hold higher-yielding assets elsewhere, which tied the yen and Japanese yields to capital flows across Asia and further afield. As domestic yields rise and the curve normalizes, the relative appeal of holding yen assets against foreign assets shifts.
Japanese institutional investors sit on one of the larger pools of cross-border capital, and their decision to repatriate or stay invested abroad turns in part on where the JGB curve settles. That recalculation is one of the channels through which a change in Japanese policy reaches markets across the region. The JGB curve is a domestic instrument with a regional footprint, which is why desks well outside Tokyo watch the Bank of Japan's operations as closely as they watch their own central banks.