Stock Connect explained: northbound and southbound flows
Stock Connect links the mainland Chinese exchanges and the Hong Kong exchange through two parallel channels, moving in opposite directions, that have become one of the most closely watched flow indicators in Asian equity markets.
Two channels, two directions
Northbound trading routes international and Hong Kong-based investors into mainland-listed shares on the Shanghai and Shenzhen exchanges, settling through Hong Kong's clearing infrastructure without requiring a separate mainland brokerage account. Southbound trading runs the other way, letting mainland Chinese investors access Hong Kong-listed shares through their existing domestic brokerage relationships. Both channels operate under daily and aggregate quota limits, monitored by the Hong Kong Exchanges and Clearing (HKEX) and the mainland exchanges jointly, though in practice utilisation rarely approaches the formal caps in normal market conditions.
Why the flow direction carries information
Because each leg settles through the home market's own plumbing rather than a shared cross-border settlement system, average daily turnover on each leg is reported separately and has become a standard reference point for gauging cross-border investor sentiment. A sustained run of net northbound buying is typically read as international and Hong Kong investors increasing conviction in mainland equities, while southbound flows are read as a proxy for mainland investor appetite for Hong Kong-listed names, including the technology and consumer companies that list there rather than on mainland exchanges.
How the mechanism has evolved
Stock Connect launched in 2014 with the Shanghai leg and expanded to Shenzhen in 2016, and the eligible stock universe and quota structure have both widened steadily since. ETF inclusion was added in later years, broadening southbound access beyond single-name equities. The mechanism's design, settling through each side's home infrastructure rather than building a new shared settlement layer, is part of why it scaled relatively smoothly compared with some other cross-border access schemes that required investors to open entirely new account types.
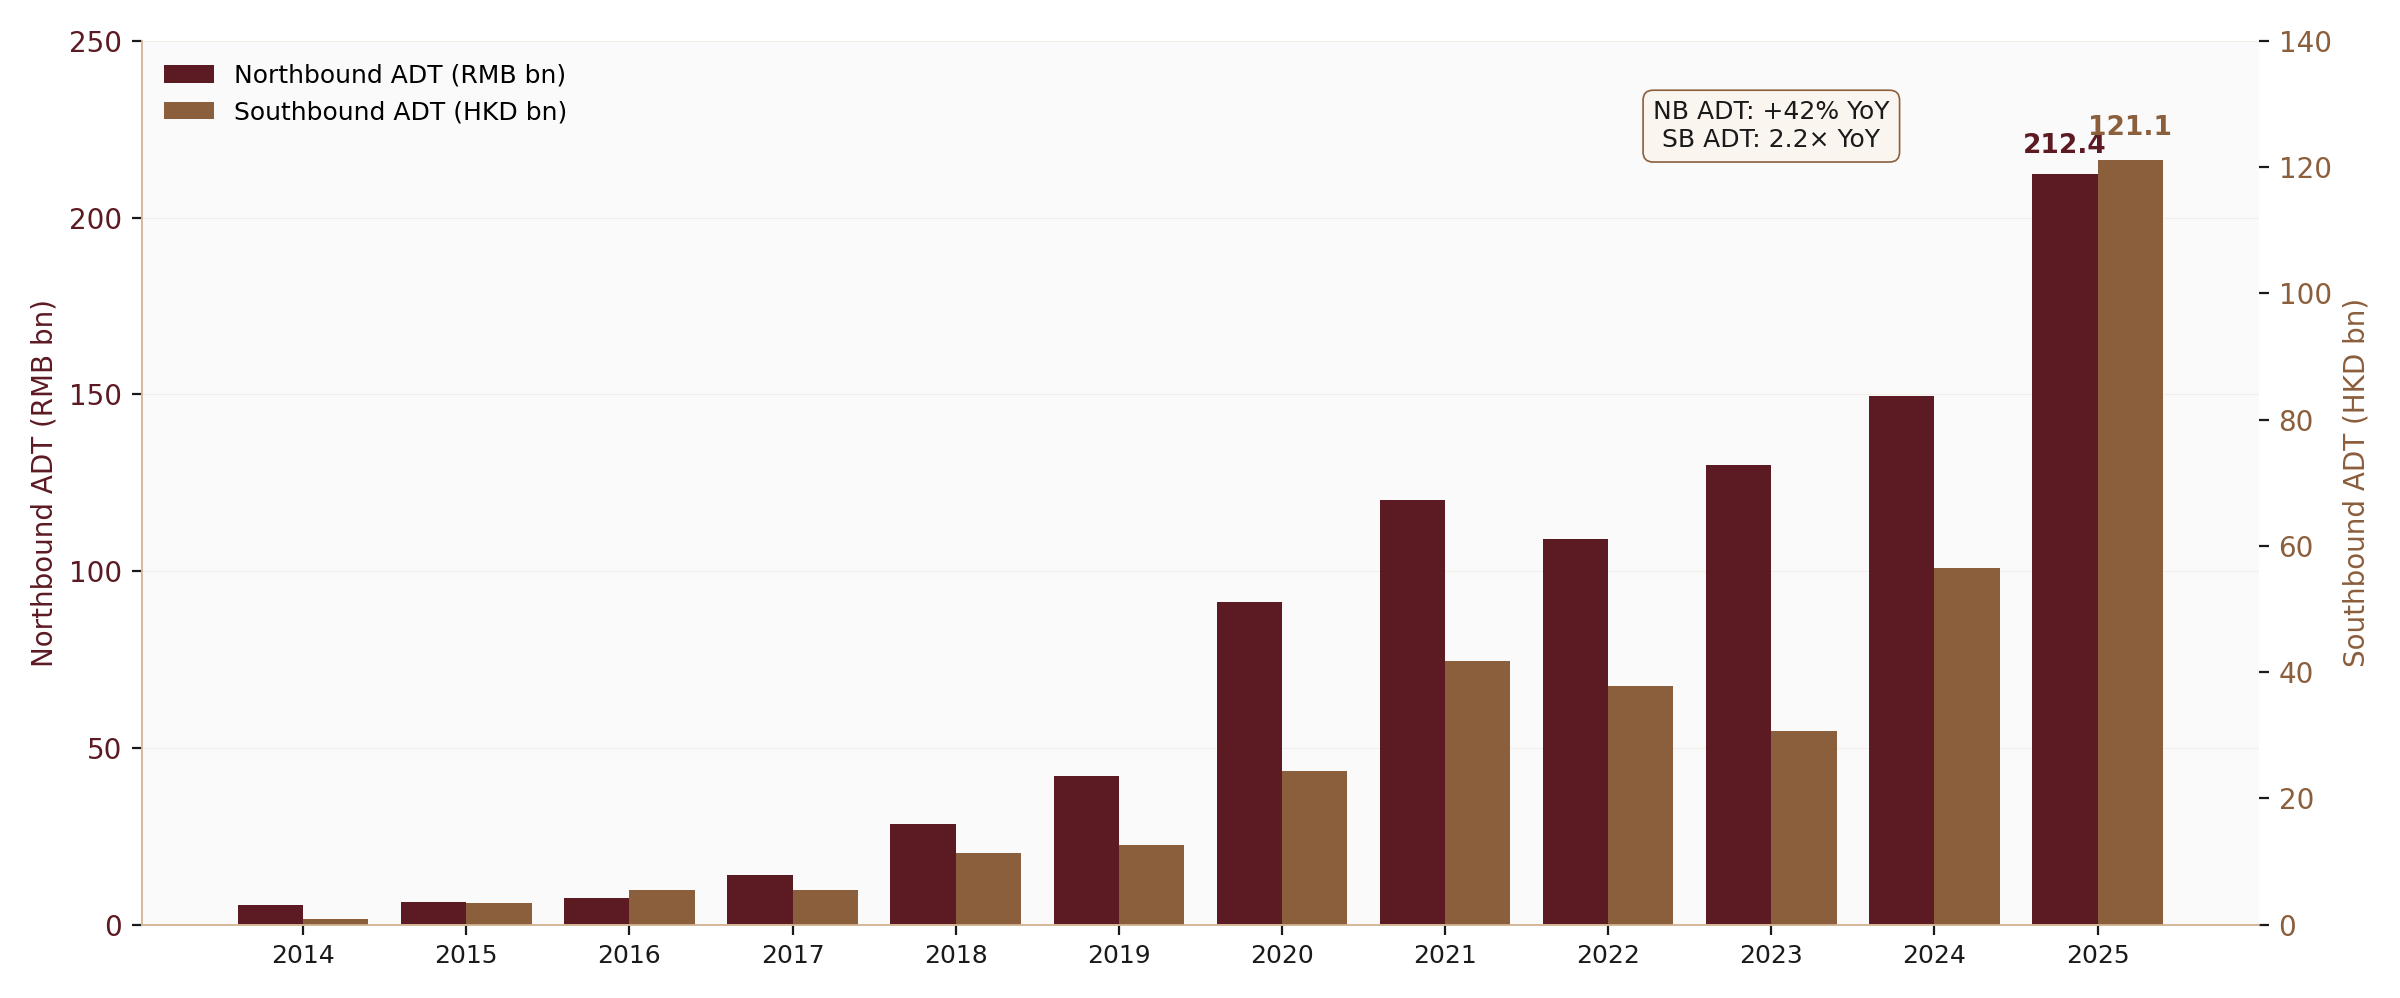
Reading the turnover chart
The chart below tracks average daily turnover on both the northbound and southbound legs from 2014 through 2025. The two lines do not move in lockstep, and the gap between them at any point is itself informative: a widening northbound lead suggests international capital finding more conviction in mainland names than mainland capital is finding in Hong Kong-listed ones, and a narrowing gap suggests the reverse. Watching this spread over time gives a cleaner read on relative cross-border sentiment than either leg's absolute level alone.