China's banking system: structure, margins, and asset quality
China's banking system is organised into five regulatory categories, with six large state-owned commercial banks anchoring the system by asset size. Reading that structure alongside the margin and asset-quality trends running through it gives a fuller picture of where stress, if any, is actually concentrated.
The five-category structure
The National Financial Regulatory Administration (NFRA) groups banks into large state-owned commercial banks, joint-stock commercial banks, city commercial banks, rural financial institutions including rural commercial banks and credit cooperatives, and a residual category covering foreign banks and other institutions. Assets concentrate heavily in the largest tier: the six state-owned commercial banks, Industrial and Commercial Bank of China, China Construction Bank, Agricultural Bank of China, Bank of China, Bank of Communications, and Postal Savings Bank of China, hold the bulk of system-wide assets and carry policy lending responsibilities alongside their commercial operations.
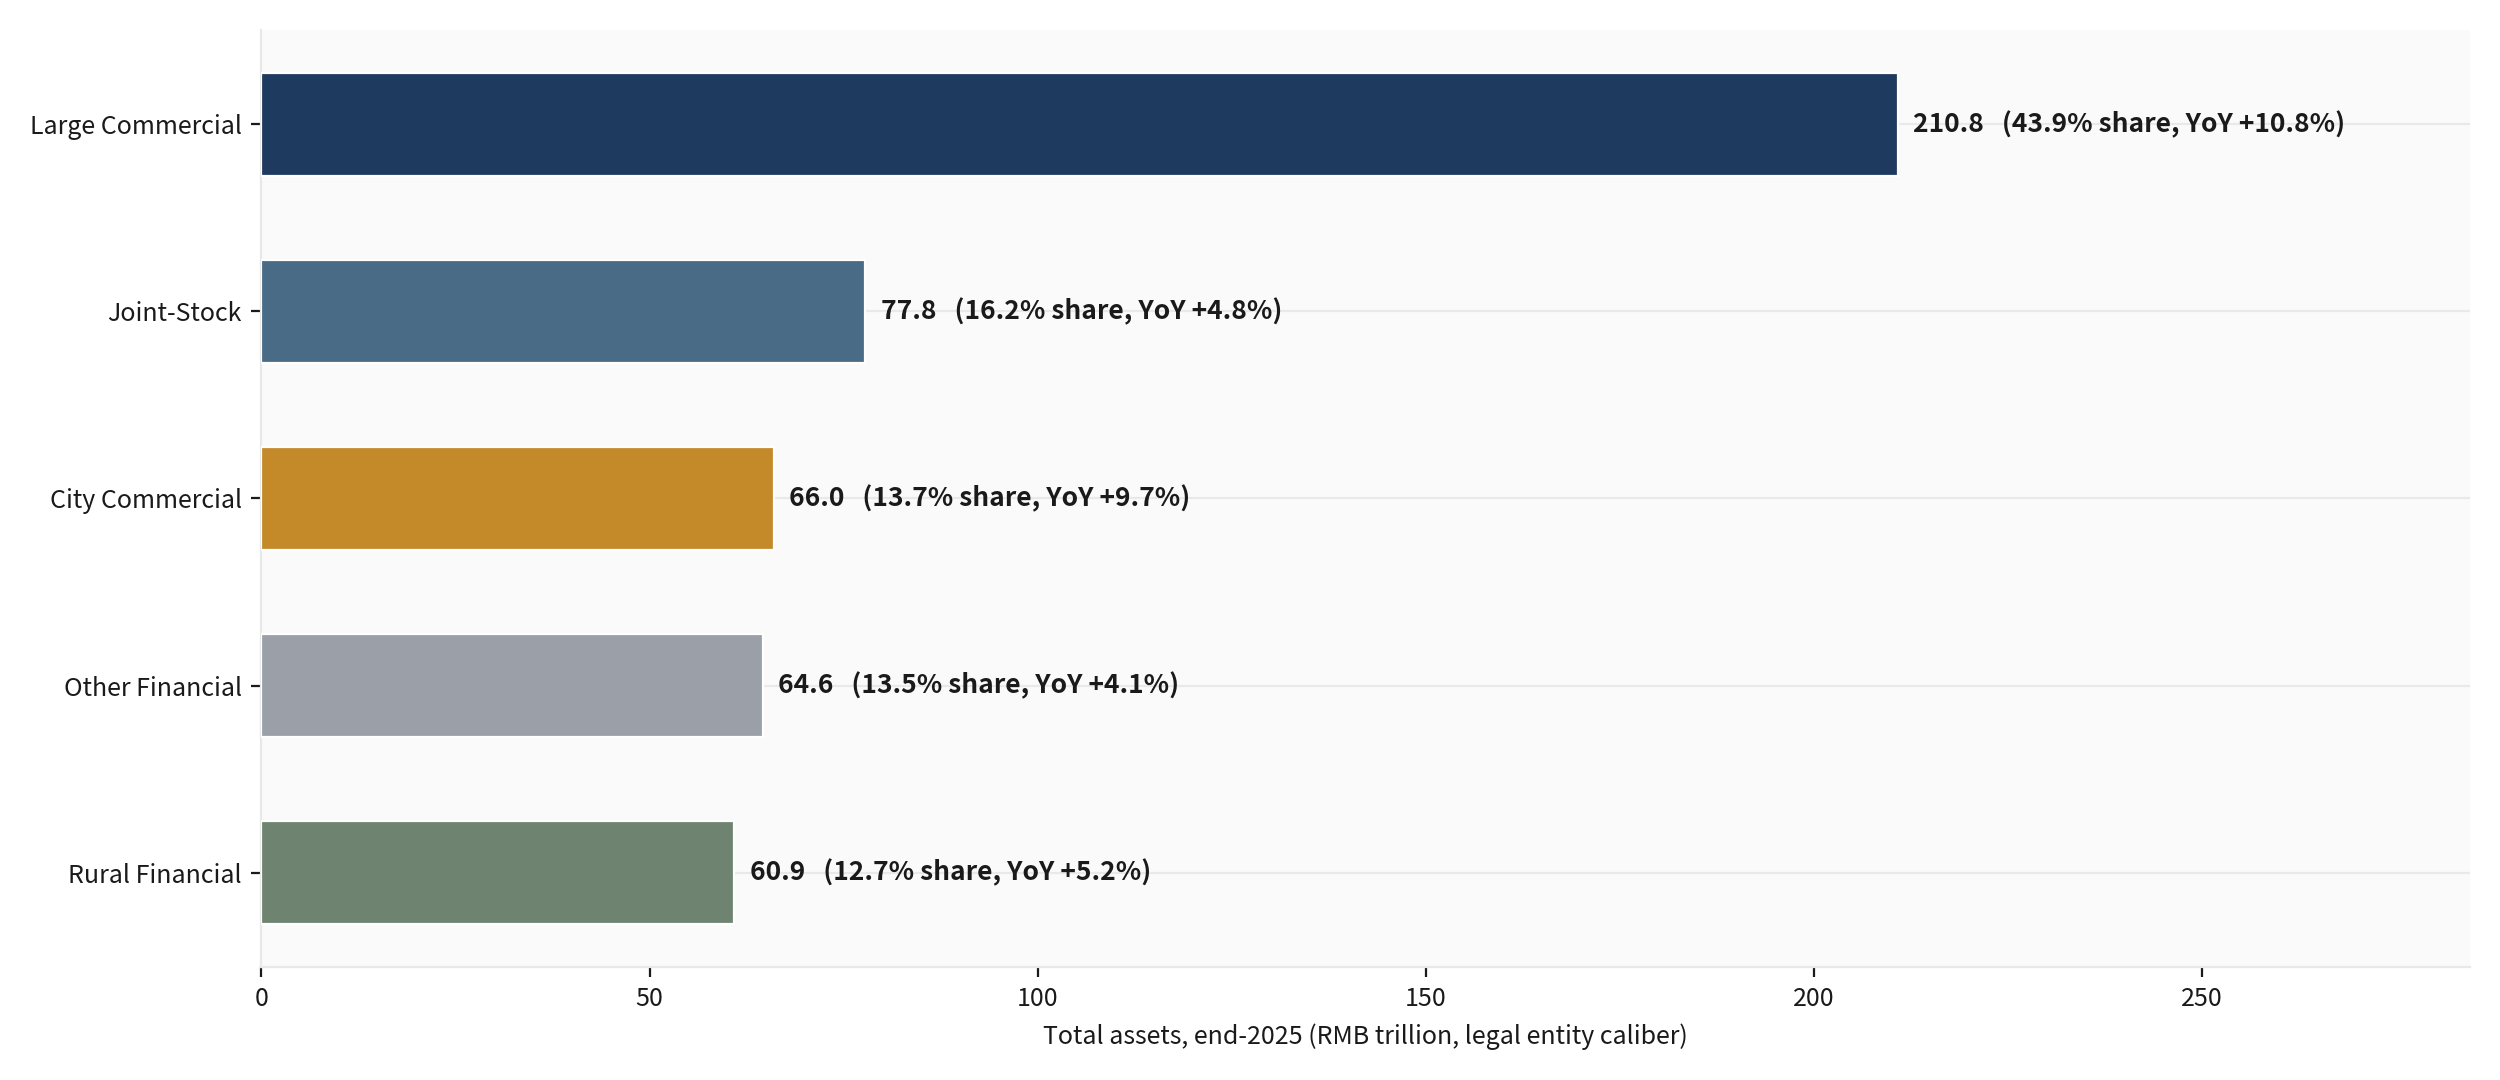
Why the tiering matters for risk
Smaller categories, particularly rural and city commercial banks, tend to carry more geographically concentrated exposure, often tied closely to local government finances and regional property markets. This is why banking-sector stress in China has historically shown up first and most visibly at smaller regional institutions rather than at the systemically important large banks, even when the underlying credit-quality pressure, such as a regional property downturn, is shared across the whole system. The five-category breakdown is therefore a more useful diagnostic tool than a single system-wide asset number.
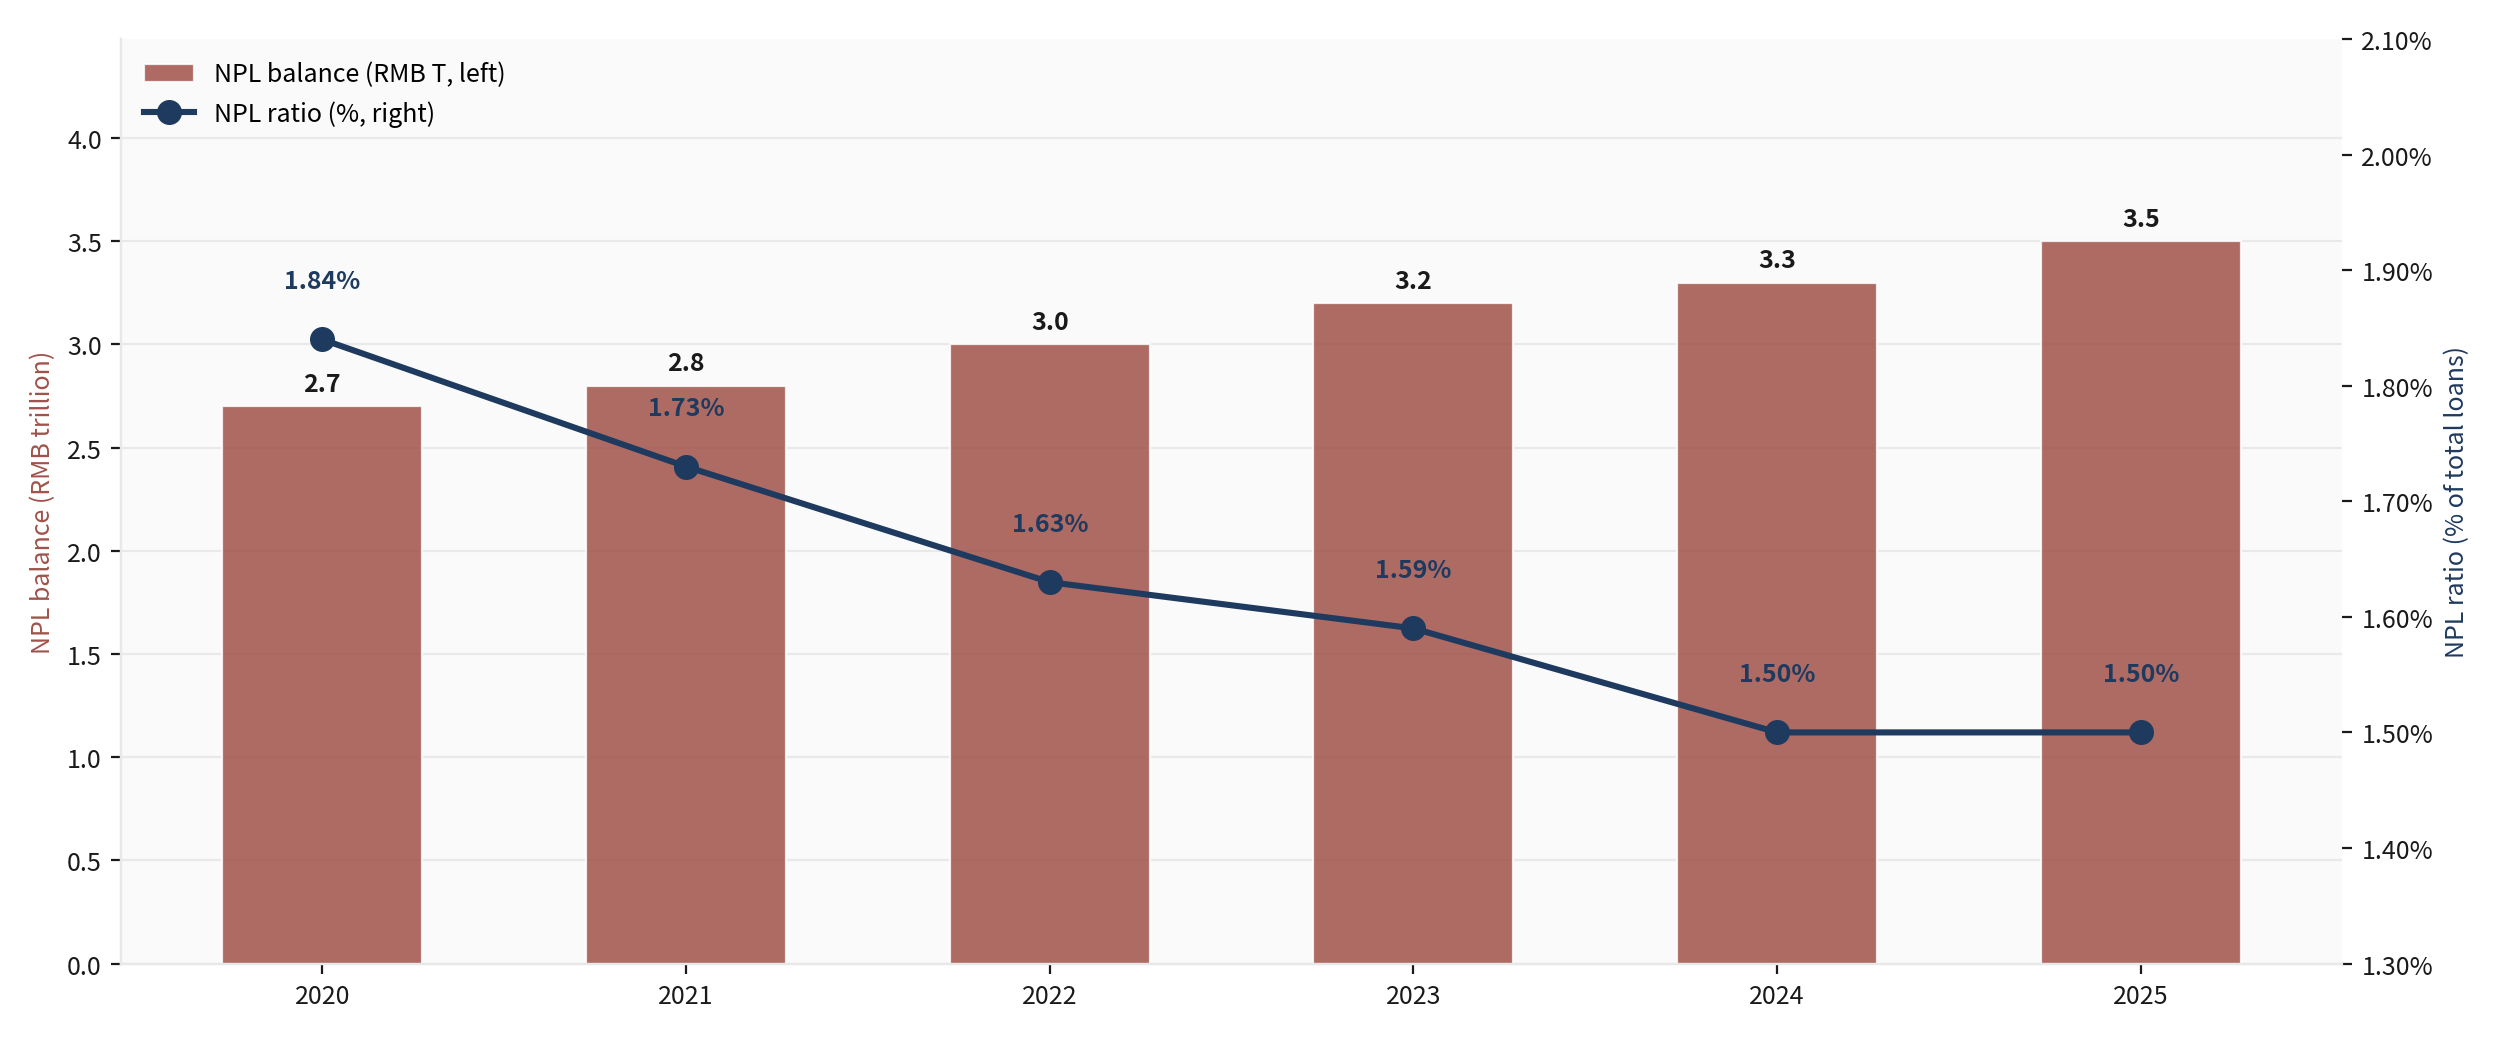
Margin compression and asset quality
Running across all five categories is a margin story: the net interest margin, the gap between what banks earn on loans and pay on deposits, has compressed in recent years as lending rates fell in line with the Loan Prime Rate while funding costs adjusted more slowly. On asset quality, the non-performing loan ratio and the underlying NPL balance are the standard gauges the regulator reports, and capital adequacy and core tier-one capital ratios show the buffer banks carry against losses, with the largest banks subject to additional loss-absorbing capacity requirements under global systemically important bank rules.
Reading structure and health together
The two charts below show first the asset breakdown by regulatory category and the Big Six totals, then the margin, NPL, and capital trajectory from 2020 through 2025. Read side by side, they answer a more useful question than either alone: is margin compression being absorbed comfortably within existing capital buffers, or is it coinciding with rising asset-quality stress in a way that erodes those buffers over time. The shape of both lines together, not the headline NPL ratio by itself, is the more complete read on system health.